
Las Vegas Real Estate Investment Market Report, September 2026
August data showing rent per square foot up 4% year over year, rental supply remaining tight, and stable home prices in our target segment. Explore what these trends mean for rental property investors heading into fall.

This report tracks the Las Vegas market for the type of rental properties we help clients buy. It is not a summary of the entire housing market. This report uses the most recently available MLS data, which reflects market activity through August 2026.
Key Takeaways
- Rents: Increased marginally MoM. YoY is up 4%.
- Leasing speed: Days to rent ticked up MoM to 23 days (still very healthy).
- Rental supply: Rental months of supply rose MoM to 1.3 months (still tight) even as the peak summer moving season is over. YoY is down 32%!
- Prices: Virtually flat MoM. YoY is also flat.
- Sales supply: Months of supply ticked up MoM, to 2.3 months (still very healthy). YoY is up 5%.
- Investor takeaway: Our target property segment remains resilient despite rising mortgage rates, supported by strong rental demand.
Market Scope and Methodology
This report reflects the Las Vegas market for the type of properties we typically recommend to clients, not all homes in the valley. The data applies only to properties that conform to our investment property profile and is based on data from the Greater Las Vegas Association of REALTORS (GLVAR) MLS. For all charts, please see this page.
Note: The property data in this report only includes the following:
- Type: Single-family
- Configuration: 3+ bedrooms, 2+ baths, 2+ car garages, 1,100 to 2,400 SF, one or two stories, lot size >3,000 SF.
- Rent range: $1,900/Mo to $2,400/Mo
- Price range: $320,000 to $475,000
- Location: All zip codes marked in green below that have one or more of our clients’ investment properties.
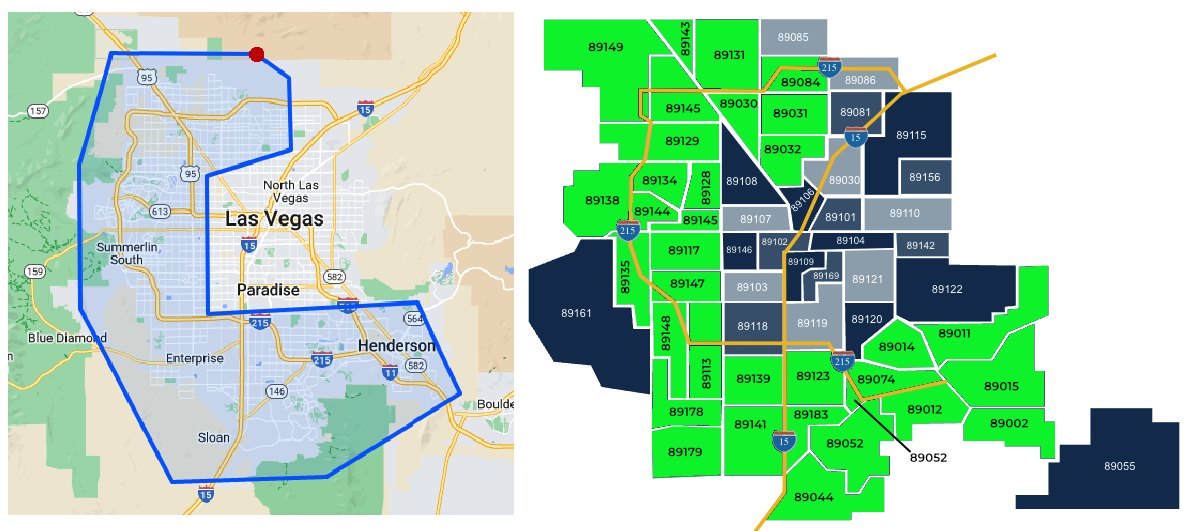
Unless noted otherwise, the charts compare the most recent month against the prior 12 months.
Starting this month, we have labeled the numbers for each month to provide more accurate information.
Rental Market
Median Rent by Month
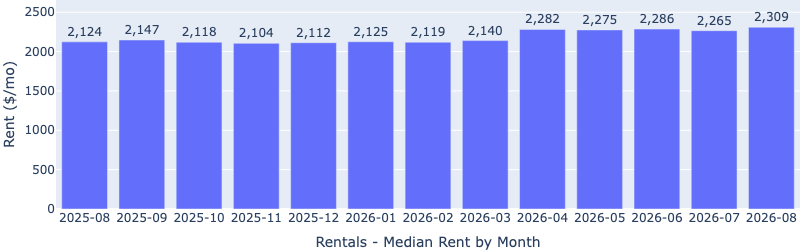
Median rent has increased meaningfully since April 2026. YoY is up 9%! Keep in mind that this data includes homes across all rent ranges, from properties renting for $1,000 per month to those renting for $3,500 per month.
Rent $/SF by Month
Rent per square foot has shown a corresponding increase since April 2026. Month over month saw a marginal increase, which is surprising for the time of year. Year over year $/SF is up 4%.

Time to Rent
Despite rising rents and the end of the summer season, median days to rent remained at a healthy 23 days, down 4% year over year. This indicates continued strength in rental demand.

Rental Supply
Inventory increased MoM, not surprising for the time of year, yet still remained at just 1.3 months. Compared to this time last year, the rental supply is down 32%! This indicates a strong landlord’s market, as rents continue to rise.

Sales Market
Median Sale Price
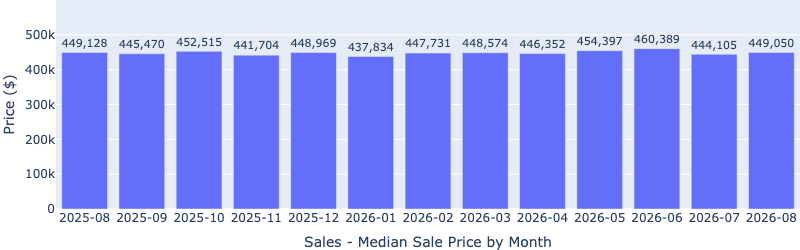
The median sale price has been tightly range-bound around $450,000 over the past 13 months, indicating a stable sales market despite higher mortgage rates, geopolitical and economic uncertainty. YoY is flat.
Price per Square Foot
Similarly, median price per square foot remained in a tight range around $250/SF. Year over year is flat. Persistently high mortgage rates and economic uncertainty have likely suppressed price growth this season.

Mortgage rates continued to rise in August, mostly above 6.75%, limiting buyer purchasing power and putting downward pressure on price growth.

Months of Supply
Inventory increased 10% MoM, to 2.3 months. YoY is up 5%. This is not surprising for the time of year and may also likely be a slight slowdown due to the interest rate hike.
A balanced market is about 6 months of supply, where prices can be expected to remain stable. 2.3 months of supply is still in the seller’s market and puts upward pressure on prices. It also signals strong buyer demand.

Days on Market
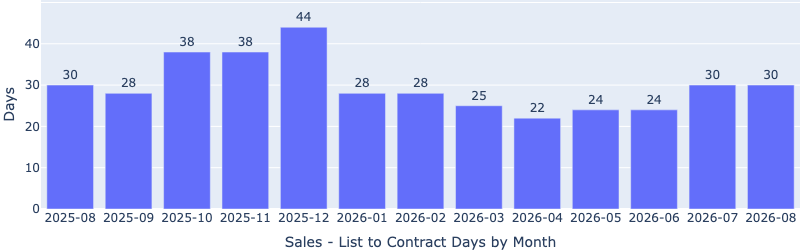
Days to sell were flat MoM at about 30 days (still healthy), which is surprising for the time of year and amid higher interest rates. This indicates a persistent high-demand environment where well-priced homes are selling within days. YoY is also flat.
What This Means for Investors
This month’s data shows that both the sales and rental markets are continuing to hold steady on their respective paths.
The rental market appears to be holding its gains following a strong growth season. Rents increased marginally month over month and are up 4% year over year. Time to rent ticked up month over month but is still down 4% year over year. Rental supply remains extremely tight at just 1.3 months, down 32% year over year. Together, these indicators continue to signal strong tenant demand and limited rental competition.
The sales market has held up amid rising mortgage rates and geopolitical and economic uncertainty. Prices are holding, and homes in our property profile are still selling quickly. Inventory is also holding (at a low level of 2.3 months). That points to persistent buyer demand and suggests home values are likely to continue to hold.
Now that fall is (almost) here, the pool of traditional home buyers has (typically) shrunk. This is the time of year when we start looking harder for great value. Historically, fall and winter have provided more opportunities to buy good properties at great prices.
Investors who buy now may be well positioned for the next appreciation and rent-growth cycle (though rent growth already seems to be happening). In the meantime, the current rental market remains strong, which means newly acquired properties are likely to rent quickly and at healthy rents.
Buy into softness and rent into strength.
Related Resources
- Annual Investor Outlook: 2026 Investor Outlook
- Investor Guides: The Fernwood Investment Framework
- Example Candidate Properties
- Schedule a Conversation: Let’s Talk Strategy
Related insights
Las Vegas Real Estate Investment Market Report, August 2026
Las Vegas rental supply remains extremely tight, rents are up year over year, and home prices remain stable despite elevated mortgage rates. Here’s what…
Where to Buy Las Vegas Investment Properties in 2026
We analyzed 10 years of median rent and time-to-rent data across five Las Vegas Valley areas to see where our target investment properties have…

Las Vegas Real Estate Investment Market Report, July 2026
The July 2026 Las Vegas real estate investment market report shows a heating up rental market and a stable sales market. Rents reach a…
Thinking about a Las Vegas rental?
A 30-minute conversation about your goals: whether Las Vegas fits your strategy, what a first property costs, and what the process looks like.
- We learn your goals and make sure we’re the right fit
- You get a clear picture of cash requirements and realistic returns
- You leave with next steps, whether or not you work with us