
New to Real Estate Investing Series – How to Analyze Rental Properties


6 min read
In this series, we covered where to start, what property type to buy, which neighborhoods to invest in, and financing options. This week, I will discuss how to analyze rental properties effectively.
Cash flow is a crucial metric for comparing rental properties. While it does not provide a precise figure for your profits, it aids in evaluating the projected performance of similar investments, allowing you to make more informed choices.
In simple terms, cash flow is the amount remaining after deducting expenses from gross rental income. These expenses encompass recurring costs like debt service, property management, taxes, insurance, and any HOA fees. Non-recurring expenses such as maintenance, vacancy rates, and tax savings will be addressed later in this article.
Which Property Is the Better Investment?
To determine which of the following two properties represents a better investment, consider the following comparison:
| Property A | Property B | |
|---|---|---|
| Purchase price | $400,000 | $250,000 |
| Monthly rent | $1,800 | $2,000 |
| Monthly expenses | $1,900 | $1,900 |
| First-year cash flow | −$100/mo | +$100/mo |
| Average rent growth rate for the city | 6%/yr | 2%/yr |
| Projected inflation rate over the hold period | 4%/yr | 4%/yr |
The better investment depends on your financial goals. If immediate cash flow is your priority and long-term performance is less of a concern, Property B is the preferable choice. However, if your aim is to generate a sustainable monthly income that maintains your lifestyle over 20 to 40 years, first-year cash flow alone may not provide the full picture.
Think in Decades
For many investors, the ultimate goal of real estate investing is to secure a reliable monthly income that lasts 20 to 40 years, ideally outpacing inflation. This income can help sustain your standard of living during retirement and can be passed down as a foundation for generational wealth.
Given that you will likely hold the property for decades, its first-year performance is far less significant than its long-term potential over the next 20 to 40 years.
Will the Rent Maintain Its Buying Power?
Inflation is a constant factor in the economy. Therefore, a critical question is whether the future rental income from the property will retain the same purchasing power it has today.
The formula below converts future rent into today’s dollars, factoring in rent growth and projected inflation:
Current purchasing power of future rent = CR × (1 + rent growth)^n ÷ (1 + inflation)^n
Where:
- CR: current rent
- Rent growth: the average annual percentage increase in rent in the property’s city.
- Inflation: projected annual inflation rate over your anticipated holding period
- n: the number of years into the future being projected.
Here’s how each property’s projected future rent translates into today’s dollars:
| Years | Property A’s Future Purchasing Power | Property B’s Future Purchasing Power |
|---|---|---|
| 10 | $2,178 | $1,647 |
| 20 | $2,635 | $1,356 |
| 30 | $3,187 | $1,117 |
| 40 | $3,856 | $920 |
Although Property B has a lower purchase price and better initial cash flow, its rent loses purchasing power over time. Conversely, Property A may start with negative cash flow but its rent increases in value over the years.
Where Does the Growth Rate Come From?
The growth rate is determined by the city, not the individual property.
Think of the city as a harbor and rents as boats. When population and demand increase, the tide rises, lifting all boats. Conversely, when the population declines, rents may drop or fail to keep pace with inflation. A property’s performance is inherently tied to the broader economic context of its city.
For rent history, refer to Zillow Research. My preferred dataset is “ZORI (Smoothed): Single Family Residence Time Series ($),” Metro & U.S. This data can help you estimate your metro’s compound annual growth rate (CAGR).
For example, Las Vegas rent was $1,226 on January 31, 2015, and $2,272 on June 30, 2026. This spans approximately 11.4167 years.
CAGR = ($2,272 ÷ $1,226)^(1 ÷ 11.4167) − 1 ≈ 5.55% per year
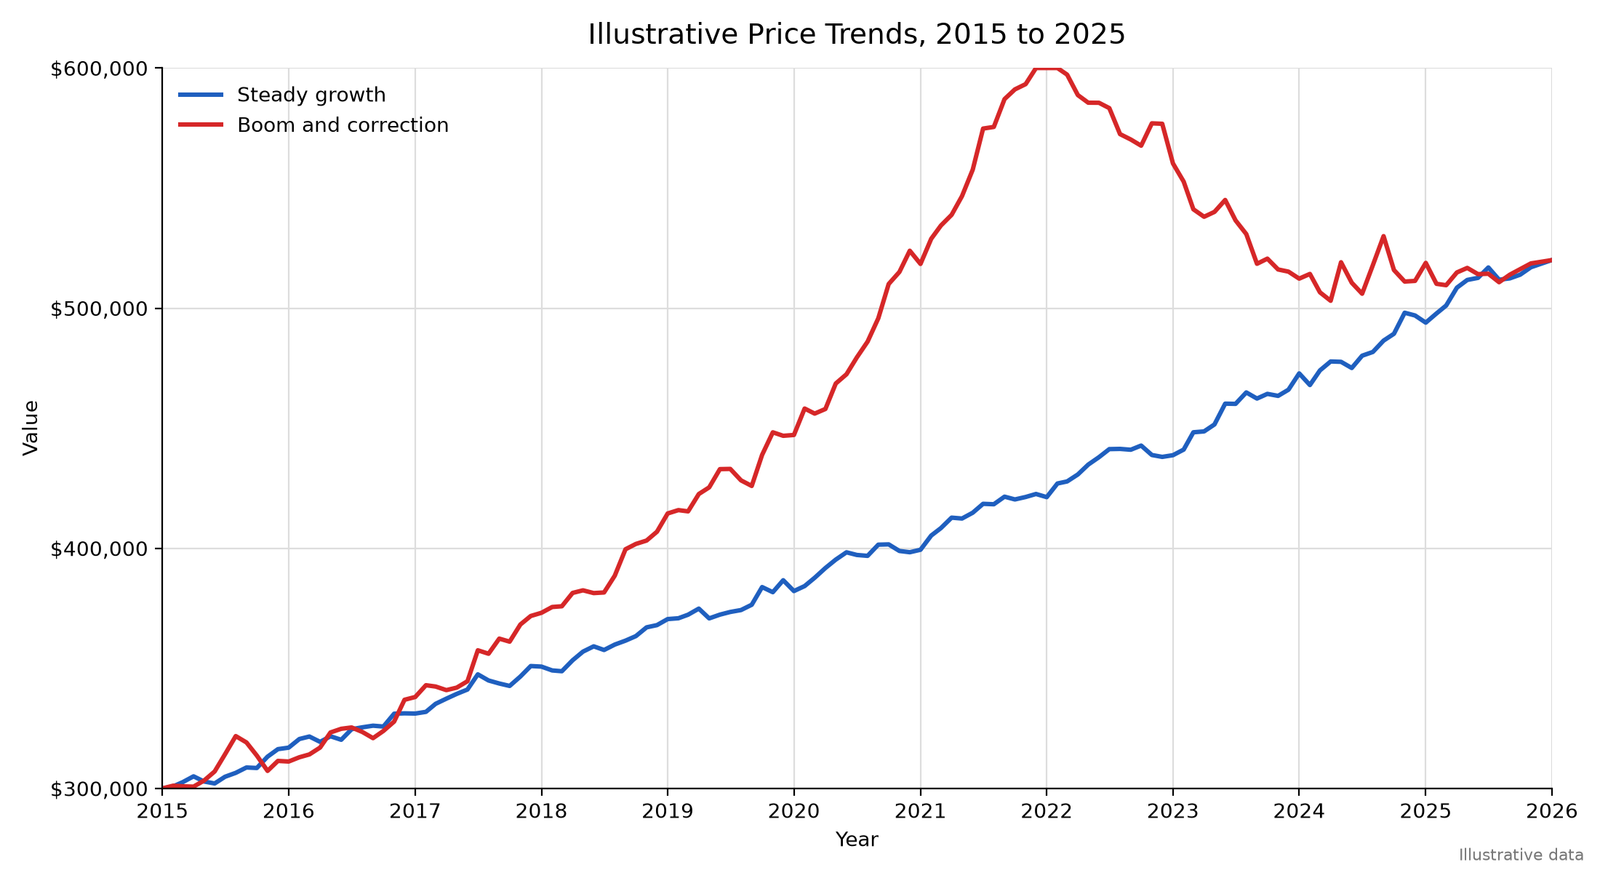
Keep in mind that CAGR uses only the starting and ending values, which can obscure the fluctuations in the data. The two lines below may share the same CAGR but tell very different stories. Always visualize the data.
Vacancy, Maintenance, and Tax Savings
Estimating future maintenance costs, vacancy rates, and tax benefits is complex, as these factors vary significantly based on the property, the tenant demographic it attracts, and your individual tax situation. However, our historical data provides useful insights.
Across over 600 investment properties we’ve managed, maintenance costs have averaged approximately $400 per year.
Our target tenants typically stay for over five years, leading us to estimate vacancy costs at around $400 per year.
In total, average maintenance and vacancy costs amount to approximately $800 per year. For a property renting for $2,200 per month, these costs represent about 3% of gross annual rent:
- $800 ÷ ($2,200 × 12) ≈ 3%
Tax benefits may offset some or all of these costs. Based on our client interviews, the average client’s marginal tax rate exceeds 32%. For a $400,000 property, with 80% of the purchase price being depreciable over a 27.5-year recovery period, the estimated annual depreciation would be:
- ($400,000 × 80%) ÷ 27.5 ≈ $11,636 per year
At a 32% marginal tax rate, the potential tax savings from that depreciation would be:
- $11,636 × 32% ≈ $3,724 per year in potential tax savings
Relative to annual gross rent, that potential benefit is approximately:
- $3,724 ÷ ($2,200 × 12) ≈ 14%
In this example, the potential tax benefit from depreciation can more than cover the estimated maintenance and vacancy costs. For simplicity, an initial analysis may exclude both categories, costs and potential tax savings.
However, actual results will vary. Vacancy costs are heavily dependent on the tenant demographic, maintenance costs depend on the property, and the ability to utilize depreciation deductions varies by investor. It’s important to note that depreciation may have future tax implications. This example serves only as an illustration and should not be interpreted as tax advice.
The Takeaway
No matter how well a property performs in its first year, that performance alone provides limited insight into its ability to support long-term financial independence. A comprehensive hold-period analysis, primarily driven by the city’s long-term economic and housing-market fundamentals, is essential for understanding a property’s likely future performance.
Related insights

Navigating the Las Vegas Rental Market for Remote Investors
9 min read Understanding the Las Vegas Rental Market: A Guide for Remote Investors Las Vegas tends to reward investors who start with the…

How Will You Finance Your First Rental Property?
7 min read Continuing our new to real estate investing series, this week I will discuss the financing options available to first-time investors. Several…

New to Real Estate Investing Series — Single-Family or Multifamily?
We’re back this week with our new-to-real-estate-investing series. In the first article in this series, we discussed the first step a new investor needs…
Thinking about a Las Vegas rental?
A 30-minute conversation about your goals: whether Las Vegas fits your strategy, what a first property costs, and what the process looks like.
- We learn your goals and make sure we’re the right fit
- You get a clear picture of cash requirements and realistic returns
- You leave with next steps, whether or not you work with us
Leave a Reply